Debugging With Xcode
You can use Xcode to build & debug WebKit. Open WebKit.xcworkspace at the top level directory.
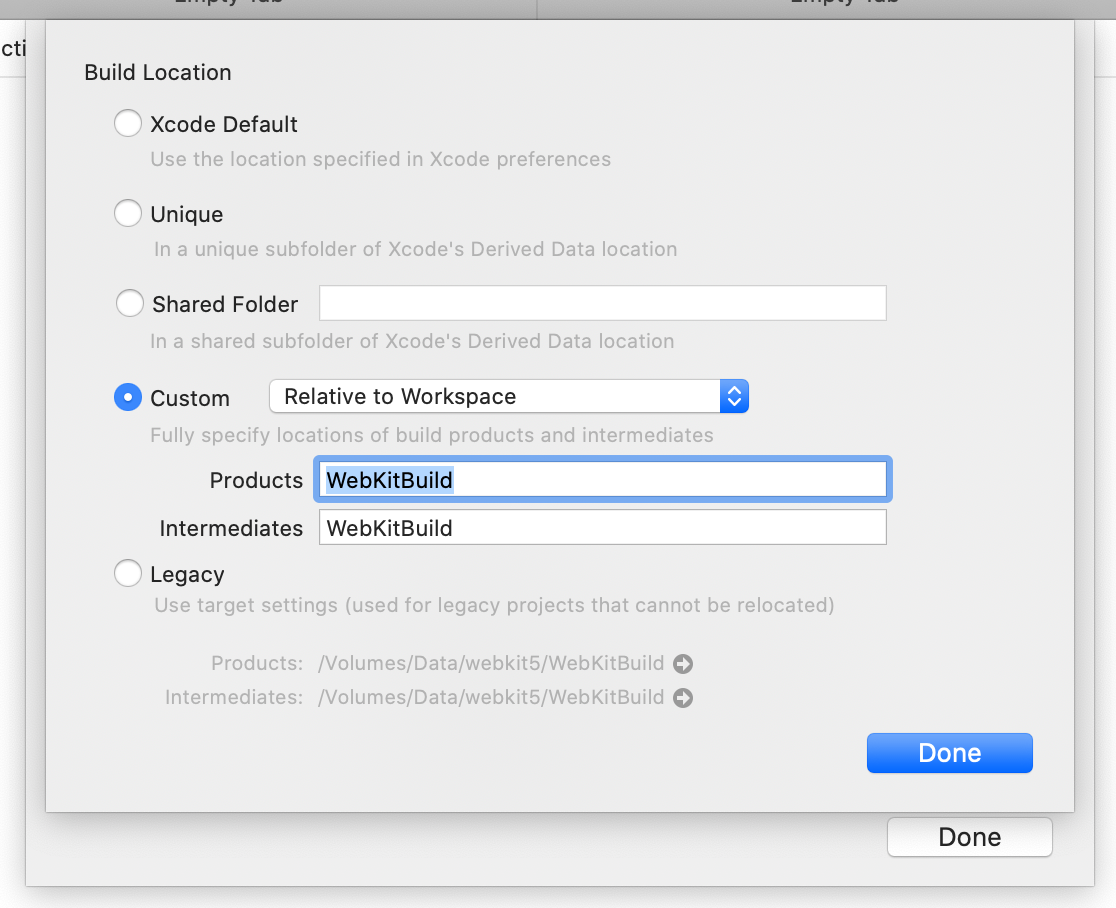
In order to make Xcode use build files built by make command above,
go to File > Workspace Settings... > Advanced... > Custom > Relative to Workspace
and adjust the relative paths of Products and Intermediates to point to WebKitBuild directory.

 Note that debugging WebCore code typically requires attaching to the relevant WebContent process,
not the application process, which is mostly running code in Source/WebKit/UIProcess.
Depending on what you’re debugging, you’d have to attach & debug different processes in the coalition.
Note that debugging WebCore code typically requires attaching to the relevant WebContent process,
not the application process, which is mostly running code in Source/WebKit/UIProcess.
Depending on what you’re debugging, you’d have to attach & debug different processes in the coalition.
You may find it useful to use the debug helpers under Tools/lldb/lldb_webkit.py.
This can be added to ~/.lldbinit for automatic loading into LLDB on launch by adding the line command script import {Path to WebKit}/Tools/lldb/lldb_webkit.py.
For more details, see the Wiki article on lldb formatters.
When debugging a debug build in LLDB, there are also a few functions that can be called on objects that will dump debugging info.
- RenderObject
- showNodeTree()
- showLineTree()
- showRenderTree()
- Node
- showTree()
- showNodePath()
- showTreeForThis()
- showNodePathForThis()
Debugging Layout Tests
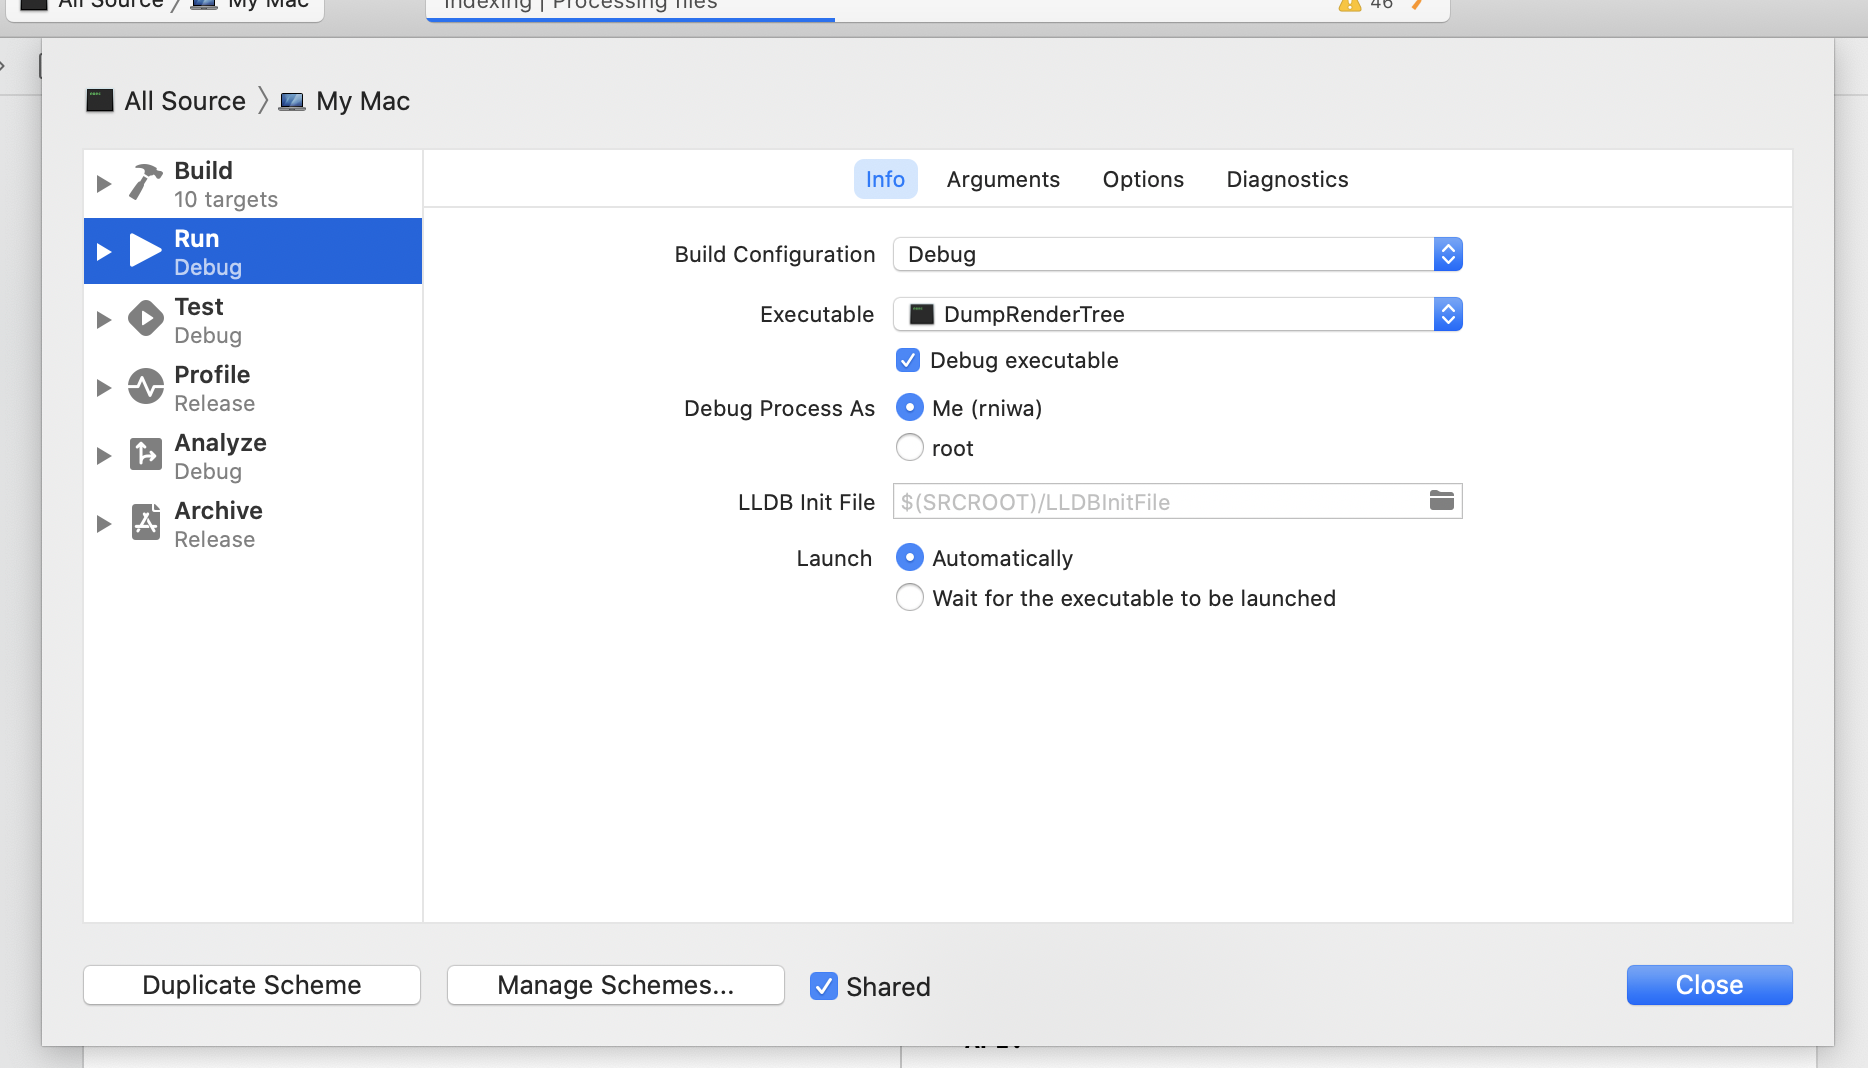
The easiest way to debug a layout test is with WebKitTestRunner or DumpRenderTree. In Product > Scheme, select “All Source”.
In Product > Scheme > Edit Scheme, open “Run” tab. Pick WebKitTestRunner or DumpRenderTree, whichever is desired in “Executable”.
 Go to Arguments and specify the path to the layout tests being debugged relative to where the build directory is located.
e.g.
Go to Arguments and specify the path to the layout tests being debugged relative to where the build directory is located.
e.g. ../../LayoutTests/fast/dom/Element/element-traversal.html if WebKitBuild/Debug is the build directory.
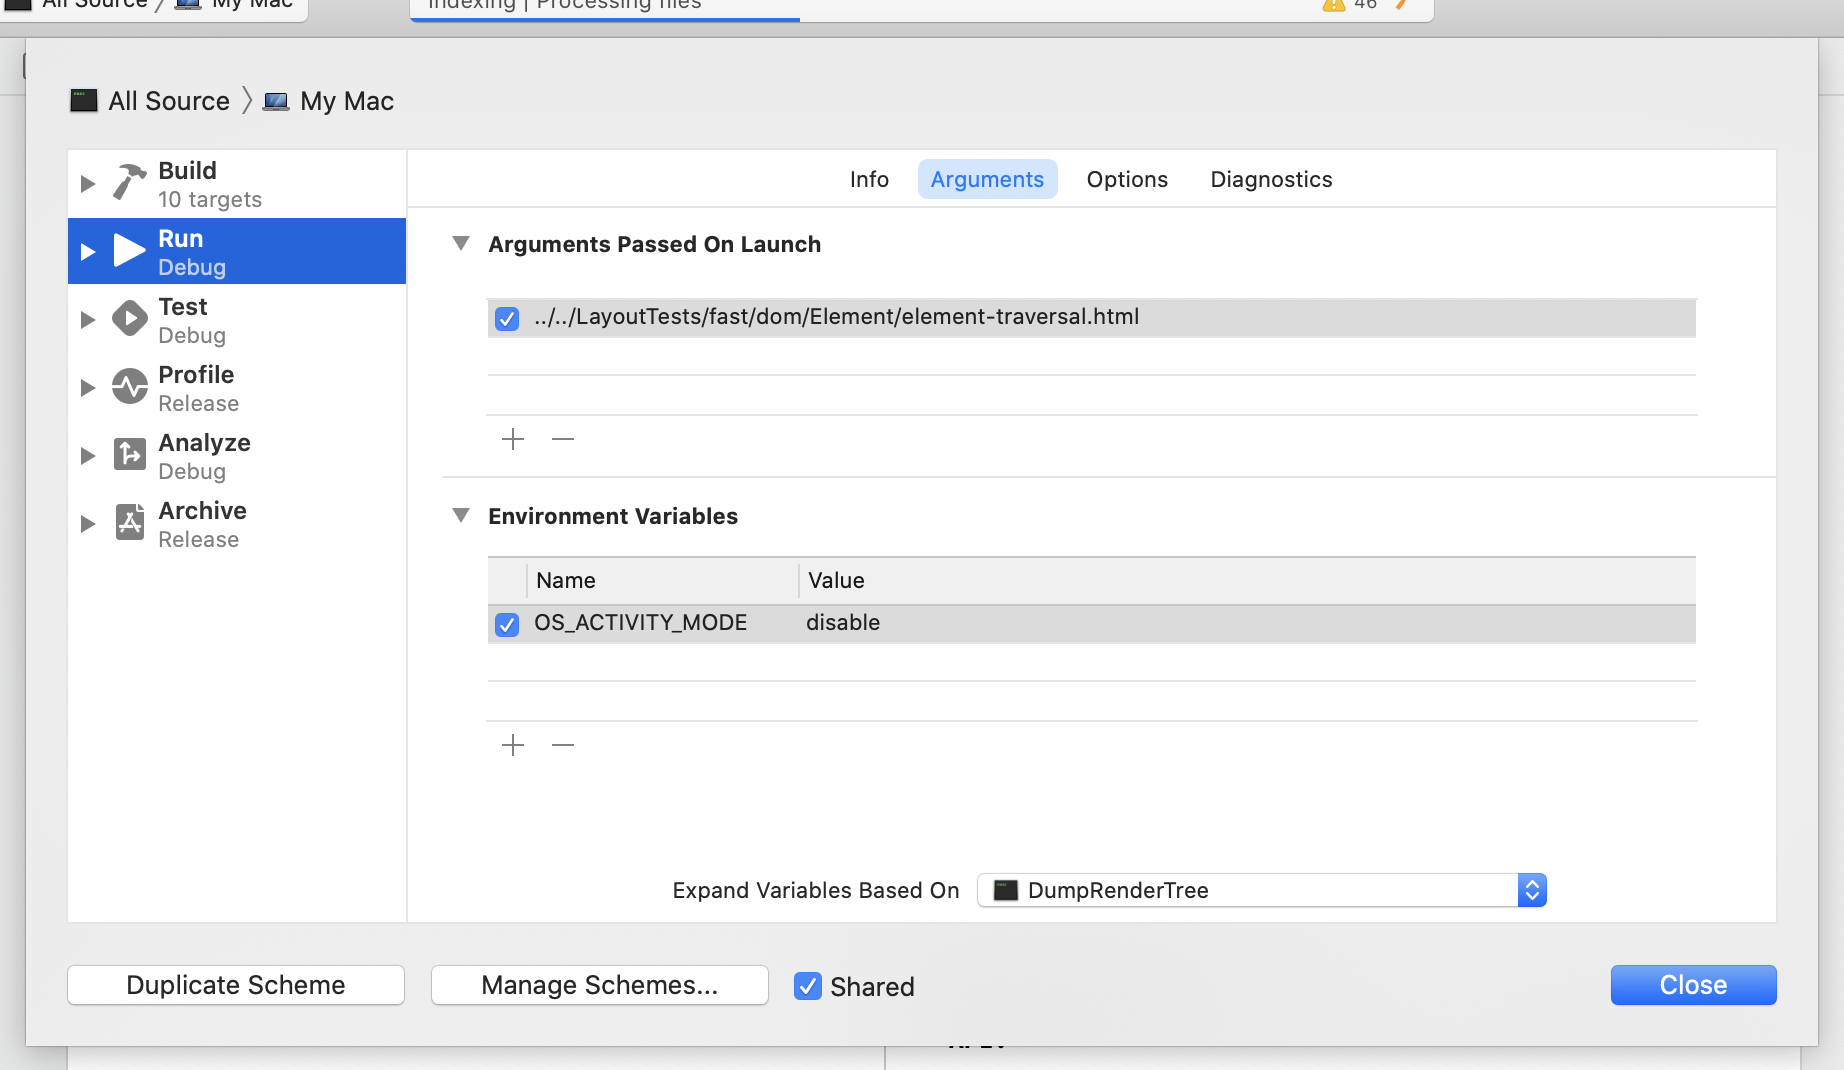 You may want to specify OS_ACTIVITY_MODE environmental variable to “disable”
in order to suppress all the system logging that happens during the debugging session.
You may want to specify OS_ACTIVITY_MODE environmental variable to “disable”
in order to suppress all the system logging that happens during the debugging session.
You may also want to specify --no-timeout option to prevent WebKitTestRunner or DumpRenderTree
to stop the test after 30 seconds if you’re stepping through code.
Once this is done, you can run WebKitTestRunner or DumpRenderTree by going to Product > Perform Action > Run without Building.
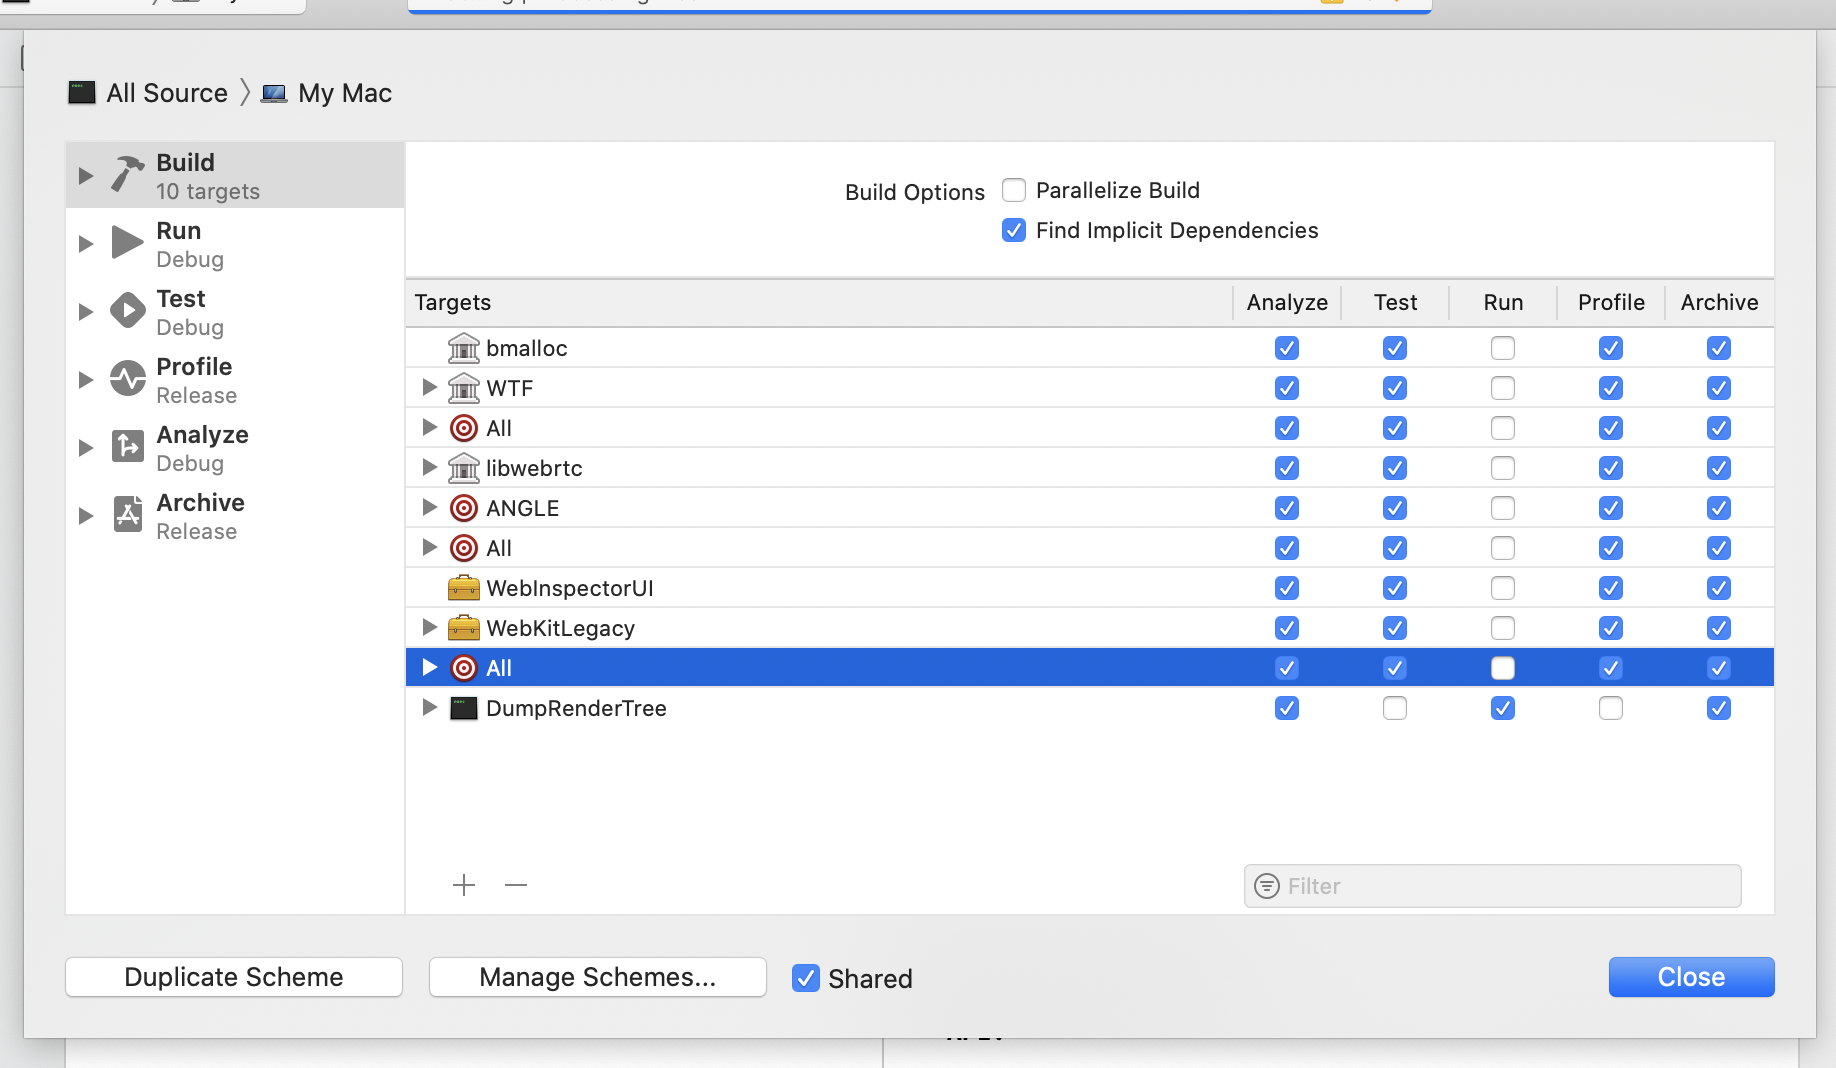
Clicking on “Run” button may be significantly slower due to Xcode re-building every project and framework each time.
You can disable this behavior by going to “Build” tab and unchecking boxes for all the frameworks involved for “Run”:
Attaching to WebContent Process
You may find Xcode fails to attach to WebContent or Networking process in the case of WebKitTestRunner.
In those cases, attach a breakpoint in UIProcess code
such as TestController::runTest in WebKitTestRunner right before TestInvocation::invoke is called.
Once breakpoint is hit in the UIProcess, attach to WebContent.Development or Networking.Development process manually in Xcode via Debug > Attach to Process.